While SharePoint Online and the broader Microsoft 365 ecosystem offer many tools to support knowledge management, knowledge sharing, and collaboration, organizations often struggle to measure the effectiveness of their intranets. The answer lies in the data. By tracking, analyzing, and acting upon key SharePoint Online analytics and metrics, you can ensure that your SharePoint-based intranet continually improves and remains a vibrant component of your organization’s knowledge management strategy.
SharePoint Online includes built-in analytics at both the site and page levels to visualize user engagement. When site owners and editors understand how their intranets are being used, they can tailor content creation and publication strategies to foster a thriving, mission-aligned intranet.
This article explores two types of SharePoint Online analytics available through the SharePoint Online interface:
- Site usage analytics
- Page analytics
Site Usage Analytics
SharePoint Online provides accessible site usage analytics for admins, site owners, editors, and members with read-only access. Data can be reviewed over the last 7, 30, or 90 days.
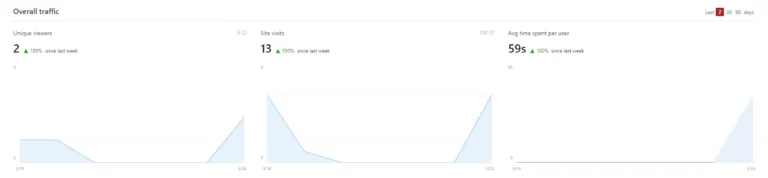
Overall Traffic Section:
- Unique viewers – Shows the total number of unique individual visitors to the site (not total visits). This metric helps you understand overall intranet adoption and reach.
- Site visits – Tracks the number of visits to content on your site, including pages, documents, and news. Repetitive actions by the same user are filtered out. Understanding which content is most frequently accessed helps guide and prioritize future content creation.
- Average time spent per user – Reflects the actual active time users spend on pages or news posts. This metric can indicate whether users are finding the information they need or just browsing without success. (Note: Usage from the SharePoint Online mobile app is not currently included.)
Popular Content in the Last 7 Days:
Popular content is segmented into site pages, news posts, and documents, and can be sorted by unique viewers or views. This helps site owners ensure frequently accessed content remains current and guides decisions on the timing of news postings.

Usage Insights:
User insights provide data on how users are accessing the intranet, as well as the most popular days and times for engagement.
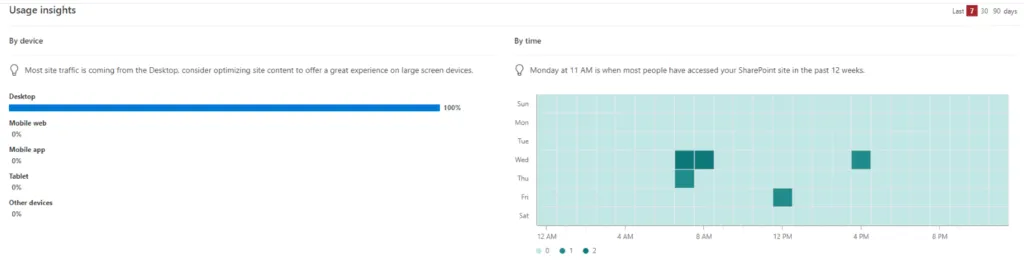
- By device – Knowing which devices are used most often empowers organizations to design intranets that align with user preferences, such as optimizing for mobile if necessary.
- By time – Displays the days and times with peak unique visitor activity in the user's time zone. This data informs when to publish time-sensitive content for maximum visibility.
Other Data Available:
- Shared with external users – Lists files accessible by the user that have also been shared externally. This helps monitor and support compliance around document sharing.
- Site usage report (Excel) – Site owners can export an Excel report summarizing 90 days of usage data, including unique viewers, site visits, popular content, device usage, and site traffic, supporting regular reporting and deeper analysis.
Page Analytics
Page analytics show how users are interacting with specific pages or news posts. Understanding access patterns helps site owners adjust posting styles for maximum utility. Reviewing high-traffic periods can also inform optimal timing for publishing important updates.
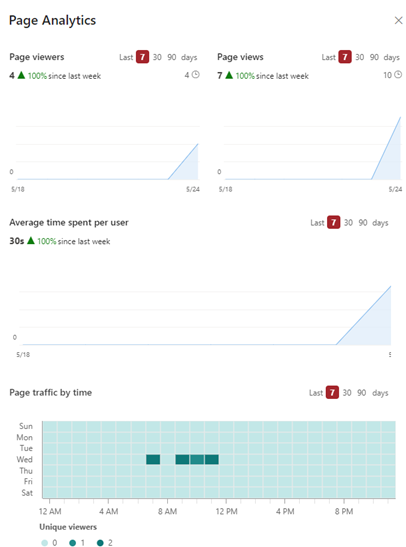
Standard Page Analytics:
- Page viewers – Total number of unique viewers for the page.
- Page views – Total number of page views, filtering out repeated actions by the same user.
- Average time spent per user – Amount of active time spent on the page. If long pages are viewed only briefly, check whether the content is clear and appropriately labeled.
- Page traffic by time – Identifies the days and times when the page receives the most visits, helping guide new content publication and news posting for highest engagement.
Conclusion
Native SharePoint Online analytics provide valuable insight but represent only part of what is possible. Additional data can be extracted from the Microsoft 365 Audit Log, but may not be easily accessible to all intranet administrators. Data such as the number of new pages published each month is not natively tracked but can be highly beneficial for knowledge management efforts. Collecting analytics is just the first step—reviewing, analyzing, and acting on this data is essential to keep your intranet fresh, relevant, and trusted.